Thursday, January 23, 2025
A Complete Guide to Omnichannel Analytics

Omnichannel analytics is more than just a buzzword—it’s a way for businesses to understand, predict, and enhance customer behavior across all platforms. In this guide, we’ll not only explain every aspect of omnichannel analytics in depth but also give you practical, actionable advice to make it work for your business.
1. What is Omnichannel Analytics, and How is It Different?
This image is publicly available on the internet. If there are any copyright concerns, please contact us for removal.
Picture this: a customer browses your website for sneakers but doesn’t make a purchase. The next day, they walk into your store, and your staff is notified of their browsing history, enabling them to recommend the exact sneaker model. Later, the customer receives a personalized email offering a discount on socks that go with their purchase.
This smooth, interconnected experience is what omnichannel analytics makes possible. Unlike traditional analytics, which operates in silos, omnichannel analytics unifies data from multiple touchpoints—your website, app, email campaigns, social media, and in-store interactions—to create a seamless, end-to-end view of your customer’s journey.
How It’s Different
-
Traditional Analytics: Focuses on specific channels (e.g., only tracking website traffic).
-
Omnichannel Analytics: Connects all channels to reveal how customers transition between them.
Key Benefits
-
360-Degree Customer View: Know not just what customers are doing but where, when, and why they’re doing it.
-
Personalized Experiences: Tailor interactions based on holistic customer insights.
-
Higher ROI: Businesses with omnichannel strategies see an average 91% higher customer retention rate compared to single-channel strategies.
Start by auditing your current channels. Identify gaps: Are your in-store transactions completely disconnected from your online customer profiles? If yes, focus on integrating these first to create that seamless experience.
2. Why Should You Care About Omnichannel Analytics?
This image is publicly available on the internet. If there are any copyright concerns, please contact us for removal.
Let’s face it—customers today are demanding. If their journey from browsing to purchase isn’t smooth, they’re likely to jump to a competitor. Omnichannel analytics isn’t just about tracking—it’s about staying competitive in a fast-evolving market.
Imagine This Scenario
You own a furniture store. A customer visits your showroom, takes pictures of a sofa, but leaves without buying. If you’re using omnichannel analytics, their action is recorded. Two days later, they receive a notification on your app: “The sofa you loved is now 10% off.” That gentle nudge converts them into a buyer.
Key Business Outcomes
-
Enhanced Customer Loyalty: Customers are more likely to return if their experience feels personal and relevant.
-
Increased Sales: By eliminating friction in the buying journey, you’ll see higher conversions.
-
Real-Time Adaptability: Quickly identify trends, like seasonal spikes in demand, and adjust your strategy in real time.
Track drop-off points in your customer journey. For example, are customers abandoning carts online? Use this insight to send follow-up reminders or provide incentives to complete the purchase.
3. What Data Do You Need to Get Started?
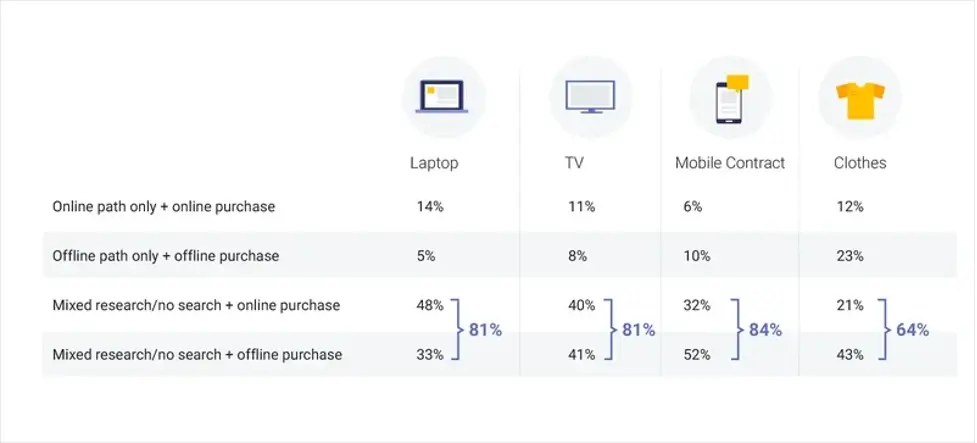
Don’t overthink it—your business already has data. More than 80% of consumers research products and make purchases using both online and offline sources, according to a poll conducted by Google's CEE and IPSOS. Omnichannel analytics works by pulling together information you’re already collecting and organizing it for actionable insights. Here’s what you need:
Key Data Types
-
Behavioral Data: Website visits, app interactions, social media engagement.
-
Transactional Data: Purchases, returns, abandoned carts.
-
Customer Profiles: Demographics, preferences, loyalty program details.
Step-by-Step Approach
-
Start Small: Focus on one channel first, like your website, to see how customers engage.
-
Integrate Gradually: Use tools like CRM software or data platforms (e.g., Segment) to centralize your data.
-
Ensure Compliance: Handle customer data with care. Regulations like GDPR and CCPA explicit customer consent for data collection.
Example in Action
An online clothing retailer noticed customers frequently abandoning carts when shipping costs were high. By analyzing this behavioral data, they introduced free shipping thresholds, boosting conversions by 30%.
4. How Does Omnichannel Analytics Work?
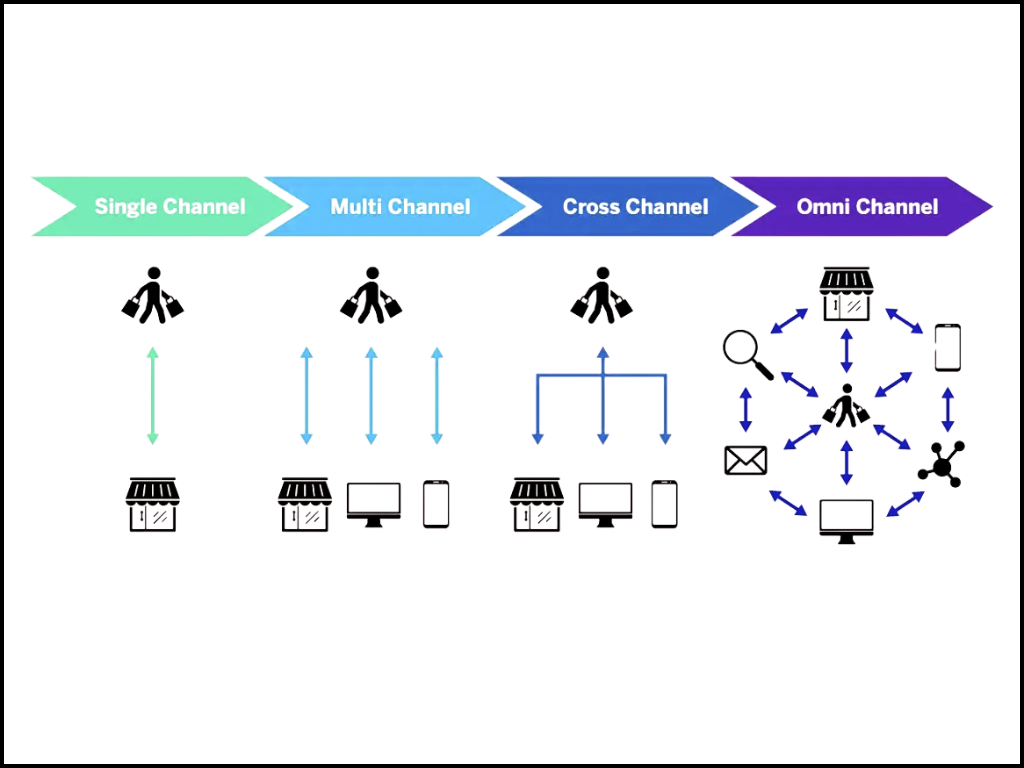
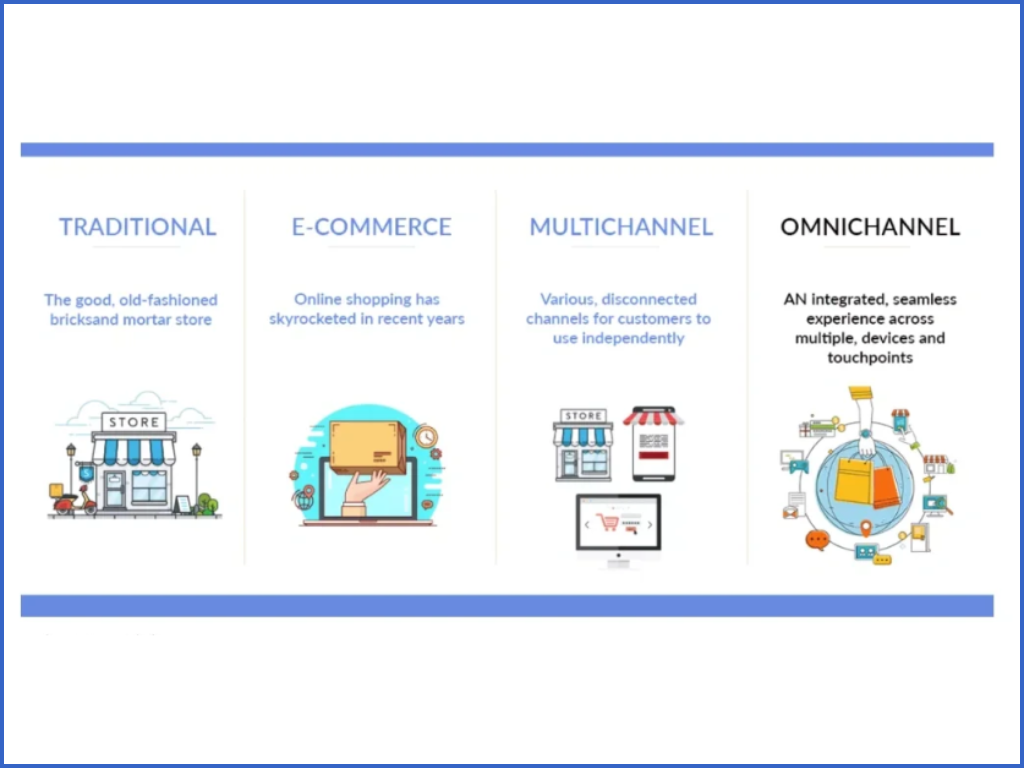
This image is publicly available on the internet. If there are any copyright concerns, please contact us for removal.
Let’s demystify the process by breaking it into manageable steps:
- Data Integration
Imagine combining puzzle pieces. Tools like Shopify, Salesforce, and Google Analytics help unify your datasets into one centralized platform.
- Data Cleaning
This step ensures your data is accurate. Duplicate or incomplete records can lead to misleading insights. Invest in tools that flag and remove errors automatically.
- Data Analysis
Using techniques like Predictive Analytics, you can anticipate trends. For example, if you know most customers shop during paydays, schedule targeted discounts accordingly.
- Implementation
Insights are only valuable if acted upon. If you identify that email campaigns perform better on Tuesdays, schedule future campaigns accordingly.
- Monitoring and Refinement
Analytics is an ongoing process. Use heatmaps to observe how customers interact with your website and refine layouts to improve engagement.
Run A/B tests (A/B Test) on small changes, like email subject lines or homepage designs. Track which version performs better and scale up based on results.
5. Measuring Success: What Metrics Should You Focus On?
The ultimate question: How do you know if your efforts are paying off? Success isn’t just about increased sales—it’s about improving the entire customer experience.
Key Metrics
-
Customer Retention Rate: Are customers coming back? If not, identify drop-off points and address them.
-
Net Promoter Score (NPS): Measure how likely customers are to recommend your brand.
-
Average Order Value: Track whether personalized recommendations encourage larger purchases.
Example
A global coffee chain used omnichannel analytics to study foot traffic patterns. They discovered customers often visited during lunch hours but rarely returned later in the day. By introducing app-based discounts for afternoon visits, they increased post-lunch traffic by 25%.
6. Mainstream Tools for Omnichannel Analytics
When it comes to implementing omnichannel analytics, choosing the right tool is critical. Below, we explore three popular platforms, their key features, pricing models, and potential limitations to help you decide which one fits your business needs.
6.1 Google Analytics 360
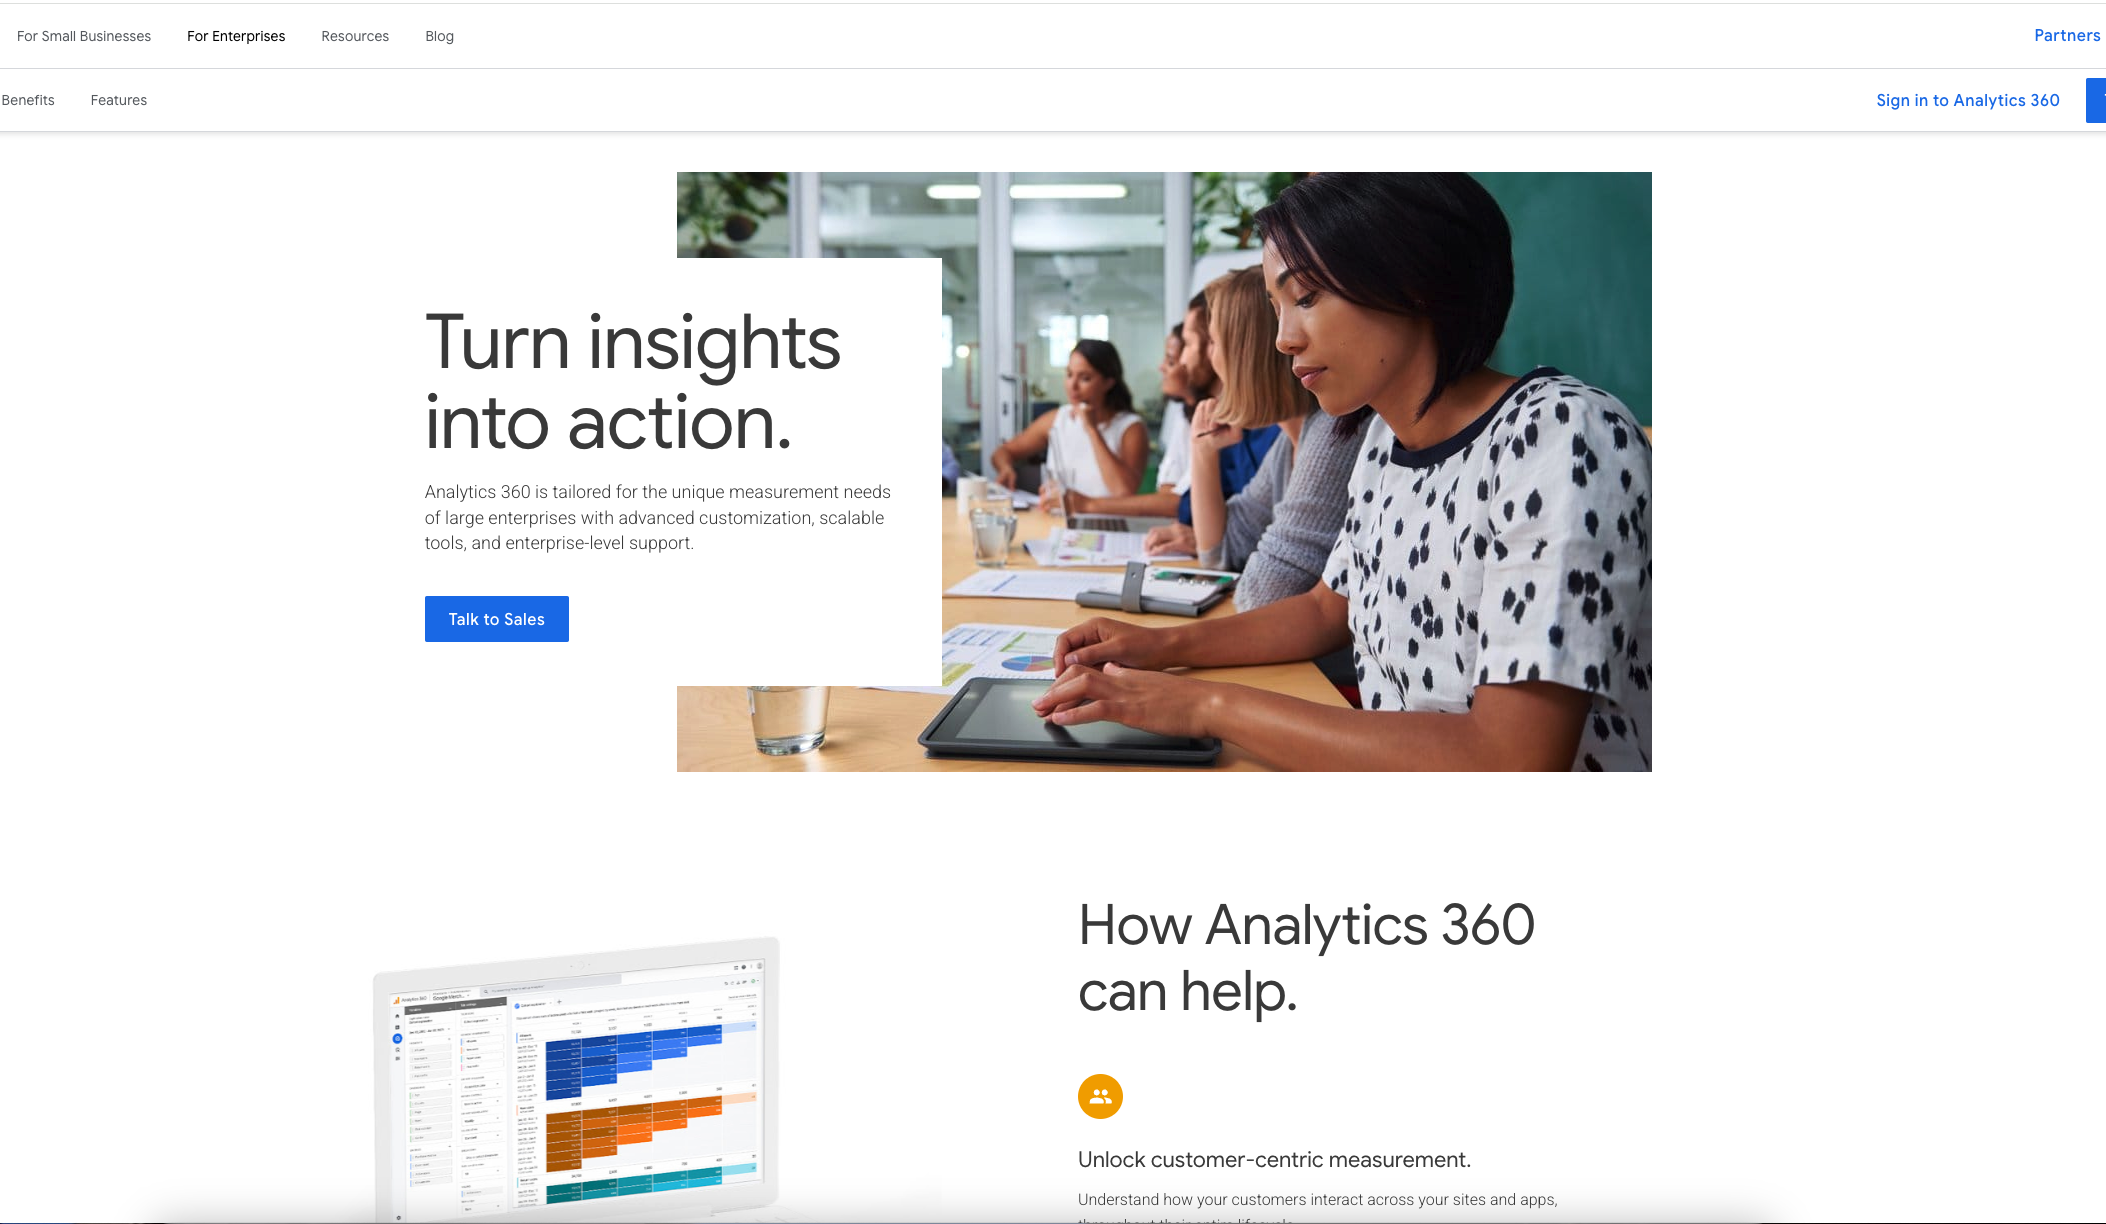
Overview: Google Analytics 360 is a premium analytics platform designed for enterprises that need deep insights into customer journeys across multiple channels. As part of the Google Marketing Platform, it integrates seamlessly with tools like Google Ads and BigQuery.
Key Features:
-
Cross-Device Tracking: Tracks customer behavior across devices (mobile, desktop, tablet), providing a unified view of their journey.
-
Custom Funnels: Analyze specific stages of the customer journey to identify drop-offs or friction points.
-
BigQuery Integration: Enables advanced data analysis and machine learning by exporting data to Google’s cloud-based warehouse.
-
Attribution Models: Offers detailed insights into which channels drive the most conversions.
Pricing:
Starts at $150,000 per year, making it suitable for larger businesses with extensive data needs.
Limitations:
-
Steep Pricing: Not suitable for small or mid-market businesses due to high costs.
-
Learning Curve: The advanced features can be overwhelming for teams without data analytics expertise.
-
Limited Customer Support: Support is slower compared to some competitors, as it heavily relies on documentation and forums.
6.2 Adobe Analytics
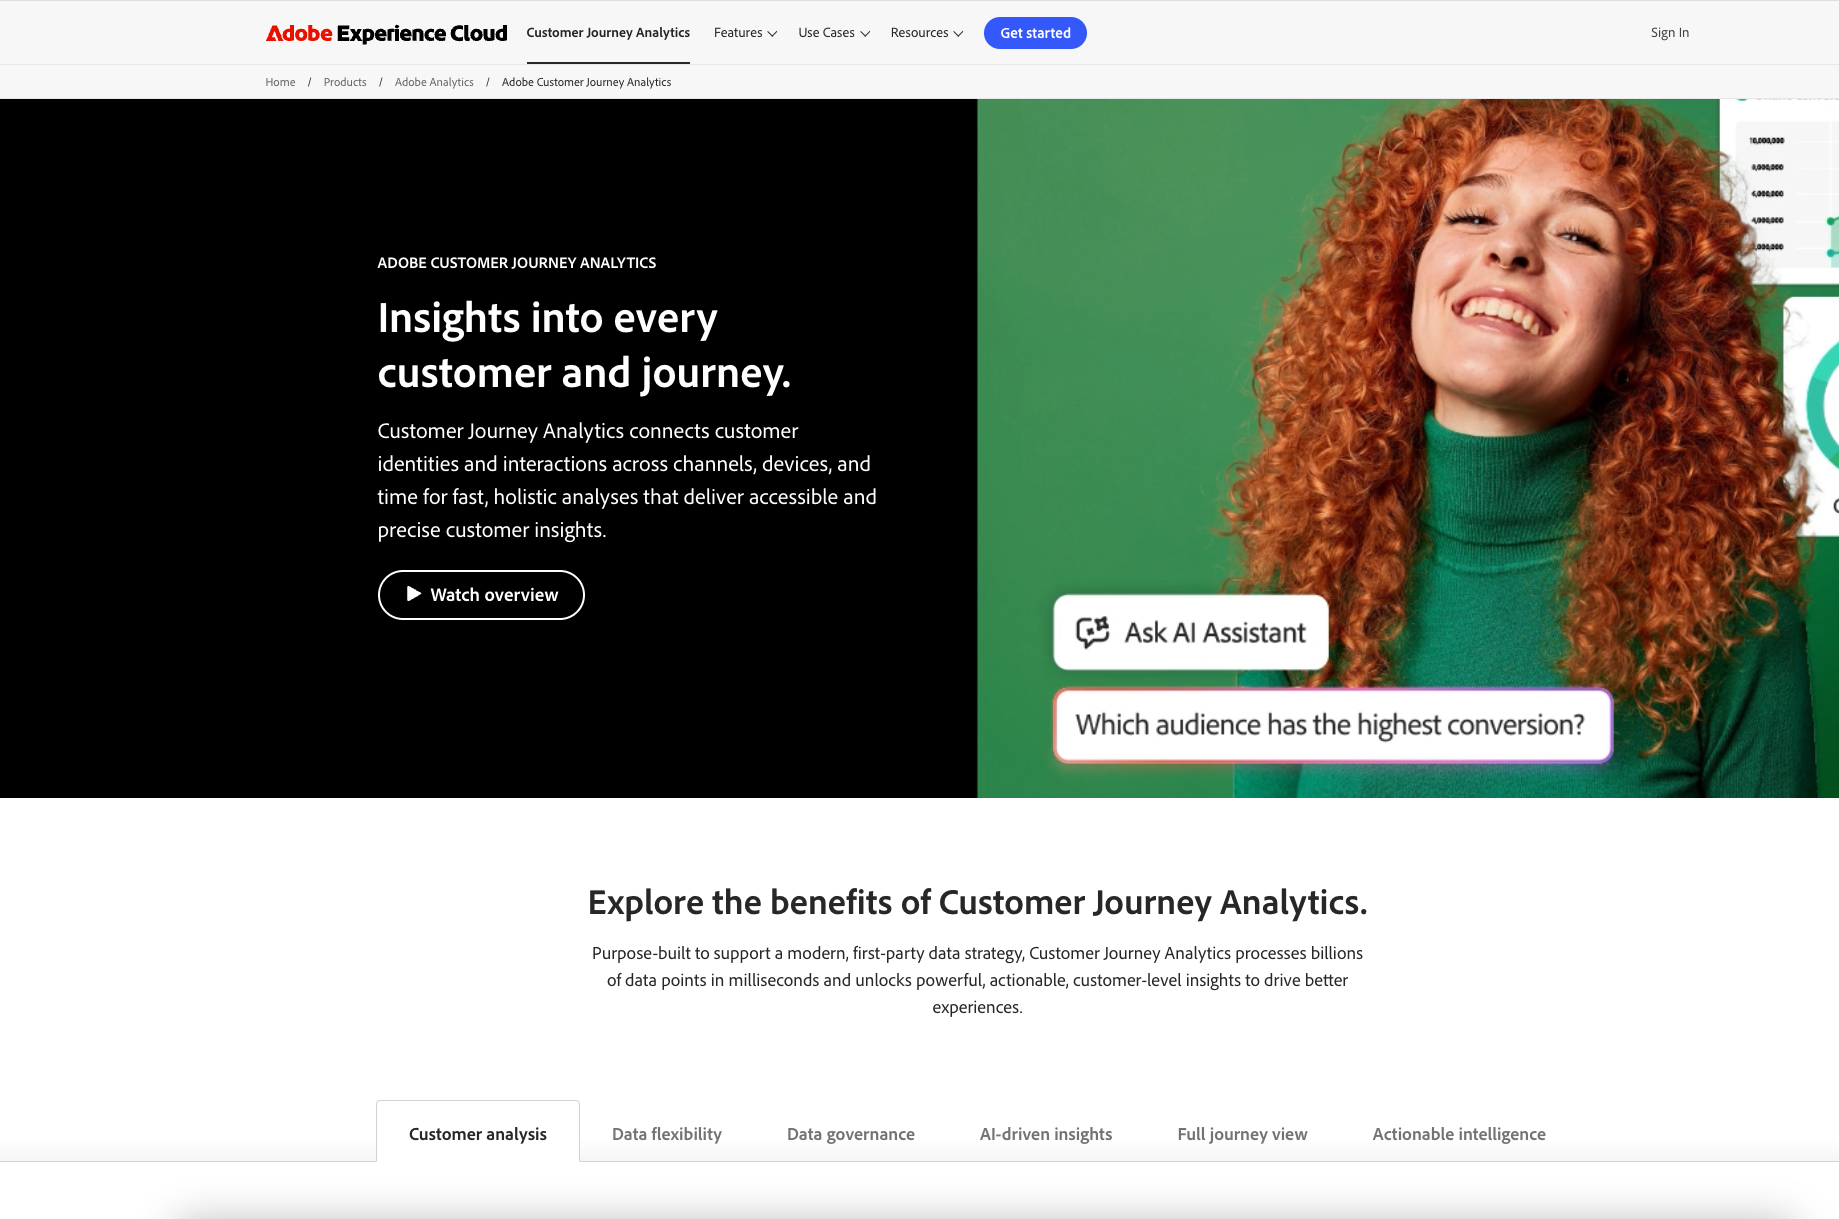
Overview: Adobe Analytics is a robust platform that leverages machine learning and AI to provide detailed insights into customer behavior across channels. It’s part of Adobe Experience Cloud, making it ideal for businesses already using other Adobe tools.
Key Features:
-
Real-Time Data Analysis: Allows you to monitor customer interactions and trends as they happen.
-
Predictive Analytics: Uses AI to forecast customer behavior and recommend actions.
-
Segmentation Tools: Easily create granular audience segments based on behaviors, demographics, and preferences.
-
Integration with Adobe Suite: Works seamlessly with Adobe tools like Adobe Campaign and Adobe Experience Manager for enhanced marketing campaigns.
Pricing:
Custom pricing based on your business needs, typically starting around $100,000 annually.
Limitations:
-
Complex Setup: Requires significant technical expertise to configure and maintain.
-
High Cost: Like Google Analytics 360, Adobe Analytics is costly, especially for small and mid-sized companies.
-
Slow Query Speeds: Some users report slow performance when analyzing large datasets.
6.3 HubSpot
Overview: HubSpot is a more affordable and user-friendly solution for small to mid-sized businesses looking to implement omnichannel analytics. While it may not have the depth of Google or Adobe, it offers excellent integrations and marketing automation tools.
Key Features:
-
Unified Data Tracking: Tracks interactions across email, social media, and websites in one place.
-
Marketing Automation: Helps automate follow-ups, segment customers, and trigger campaigns based on user behavior.
-
CRM Integration: Comes with a built-in Customer Relationship Management system to align analytics with sales efforts.
-
User-Friendly Dashboards: Easy-to-use interface suitable for teams with minimal technical skills.
Pricing:
-
Free Plan: Includes basic analytics and CRM tools.
-
Paid Plans: Start at 3,200/month for enterprise-level features.
Limitations:
-
Limited Advanced Features: Lacks some of the predictive and AI capabilities of competitors like Adobe and Google.
-
Less Customization: Reporting dashboards are less flexible compared to more advanced tools.
-
Scaling Issues: While great for small businesses, it may not scale effectively for enterprises with complex needs.
Which Tool Should You Choose?
-
If you’re a small business: Start with HubSpot for its affordability and simplicity.
-
If you’re a mid-sized business aiming to scale: Adobe Analytics offers a balance of advanced features and integration capabilities.
-
If you’re an enterprise needing deep insights and cloud integrations: Google Analytics 360 is your best bet despite the high cost.
7. ROI: Is It Worth It?
Let’s address a common fear: “This sounds expensive.” While it’s true that setting up omnichannel analytics involves an initial investment, the returns far outweigh the costs.
What to Expect
-
First 3 Months: You’ll uncover basic insights like top-performing products and channels.
-
6–12 Months: Expect measurable improvements in KPIs like customer retention and conversion rates.
-
Beyond 1 Year: Omnichannel strategies lead to long-term customer loyalty, increased market share, and higher revenue.
Pro Tip
Begin with affordable solutions like HubSpot or Zoho, which offer free trials. Once you see value, invest in more robust tools like Adobe Analytics.
8. Overcoming Challenges
Fear of change is natural, but with the right approach, challenges can be mitigated:
-
Data Silos: Break down barriers by centralizing your systems.
-
Employee Resistance: Offer training sessions to build confidence in analytics tools.
-
Privacy Concerns: Prioritize compliance and transparency with customers.
Set up workshops to educate your team on the “why” behind omnichannel analytics. Show them the potential for career growth by mastering these tools.
Conclusion: Why Now is the Time for Omnichannel Analytics
Think of omnichannel analytics as your business’s superpower. It gives you the ability to see what your customers want before they even know it themselves.
Here’s your next step:
-
Map out a single customer journey (e.g., from Instagram ad to in-store purchase).
-
Identify key touchpoints where analytics can improve engagement.
-
Test and iterate.
Don’t let competitors gain the edge while you hesitate. With this guide, you’re equipped to start small, think big, and scale fast. Take the first step today, and watch as your business transforms into a customer-focused powerhouse.
Related articles