Monday, October 28, 2024
User Experience: How to Determine the Sample Size of Questionnaire Survey

Wondering how to determine the right sample size for your survey? Let's dive into this topic together and make it crystal clear.
When conducting surveys as part of experience management, figuring out the appropriate sample size is something that often stumps many of us.
While there are online calculators available to help, if you don't understand the key variables at play, even having a calculated sample size won't help much since you won't be able to justify your choices when questioned.
But don't worry - this isn't rocket science! Let me explain it in simple terms.
Let's dive in!
What is the sample size for research?
🤔 Imagine you want to know if there's a difference in performance between long-distance runners who eat oatmeal for breakfast and athletes who don't?
To figure this out, theoretically we would need to survey every competitive runner in the country, but that's obviously not practical or feasible.
This is where determining the right sample size becomes crucial.
Sample size is simply the total number of people or items you include in your research - whether that's a survey, study, or experiment. Think of it as your research "headcount".
When conducting surveys with large populations, selecting an appropriate sample size is crucial since collecting data from everyone is impractical. Instead, you can select a representative random sample from the total population to draw meaningful conclusions.
Let's use a real-world example: Imagine you own a coffee shop chain ☕️ and want to gauge customer satisfaction with your new Hazelnut Latte ☕️. With over 500 locations nationwide serving millions of customers, surveying everyone is impossible.
This is where sampling comes in - you'll need to survey a smaller subset of your total customer base.
For instance, you might decide to survey 1,000 customers as your sample size.
To ensure this sample accurately represents your entire customer base, these 1,000 participants must be randomly selected. This random selection helps capture feedback from both loyal regulars and first-time visitors alike.
The responses from these 1,000 customers will give you valuable insights into overall customer preferences for the Hazelnut Latte ☕️.
For example, if 750 of your surveyed customers express satisfaction with the new drink, you can conclude that, within specific confidence levels and intervals, there is strong positive sentiment toward the Hazelnut Latte ☕️.
These insights enable data-driven decisions about whether to continue promoting the Hazelnut Latte ☕️ or make adjustments to the recipe.
This example demonstrates how choosing an appropriate sample size is essential for gathering reliable data that can inform strategic business decisions.
What do I need to know to calculate the sample size?
When studying large populations, it's usually impossible to survey everyone - that's where sampling comes in.
But how can we make sure our sample truly represents the whole population? We need to understand four key statistical concepts: confidence interval, confidence level, population size, and standard deviation.
1. Confidence Interval
Think of the confidence interval as your margin of error - how much wiggle room you're willing to accept in your results.
Let's say you surveyed people about their Mother's Day gift plans and found that 65% intended to buy gifts, with a confidence interval of ±2.75%.
This means you're confident (but not 100% certain) that the true percentage falls between 62.25% and 67.75%.
It's like measuring something with a slightly blurry ruler - you might say it's between 9 and 11 centimeters rather than giving an exact number.
2. Confidence Level
The confidence level tells you how sure you can be about your results.
With a 95% confidence level, it's like saying if you did the same survey 20 times, 19 of those times would fall within your confidence interval.
Think of it like taking that ruler measurement 20 times - 19 times you get a reading between 9 and 11 centimeters.
3. Population Size 🌍
This is simply the total number of people in your target group.
For example, if you're studying residents of New York City, your population size would be the total number of people living there.
4. Standard Deviation 📊
Standard deviation measures how spread out your data is.
If everyone gives similar answers, you have a small standard deviation. If answers vary widely, you have a large standard deviation. A smaller standard deviation means you can use a smaller sample size, while more varied responses require a larger sample to get accurate results.
When you combine all these factors, you can calculate the ideal sample size to make your survey both accurate and reliable.
Want less error? You'll need more samples. Can you tolerate more error? Then you can use a smaller sample size.
Of course, for critical research that will inform major decisions, you'll want to minimize error as much as possible - which means using a larger sample size to ensure reliable results.
How to Calculate Your Sample Size?
Understanding Z-scores and sample size formulas is essential for determining your ideal sample size. Even without knowing your total population size, you can still figure out how many responses you need for reliable results.
1. Understanding Z-scores
Think of a Z-score as a measuring stick - it tells you how far a data point sits from the average in terms of standard deviations. When planning your sample size, the Z-score reflects your desired confidence level.
The most common confidence levels you'll use are 90%, 95%, and 99%, which give you Z-scores of 1.645, 1.96, and 2.576 respectively.
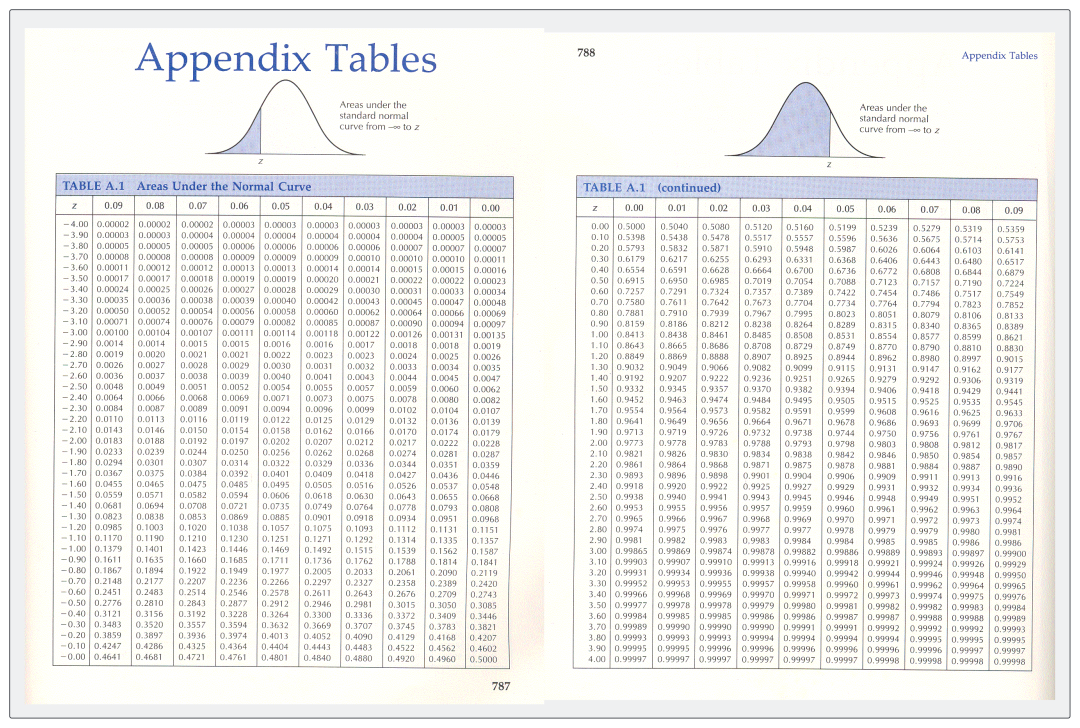
To find the right Z-score, we'll use something called a "normal distribution Z-value table". I've included the complete table below for your reference.

2 How to Read a Normal Distribution Z-Value Table?
Let's work through an example: finding the Z-score for a 90% confidence level. (Note: We only know we want 90% confidence, but we need to find the actual Z-score of 1.645)
2.1. Understanding Confidence Levels and Z-Scores
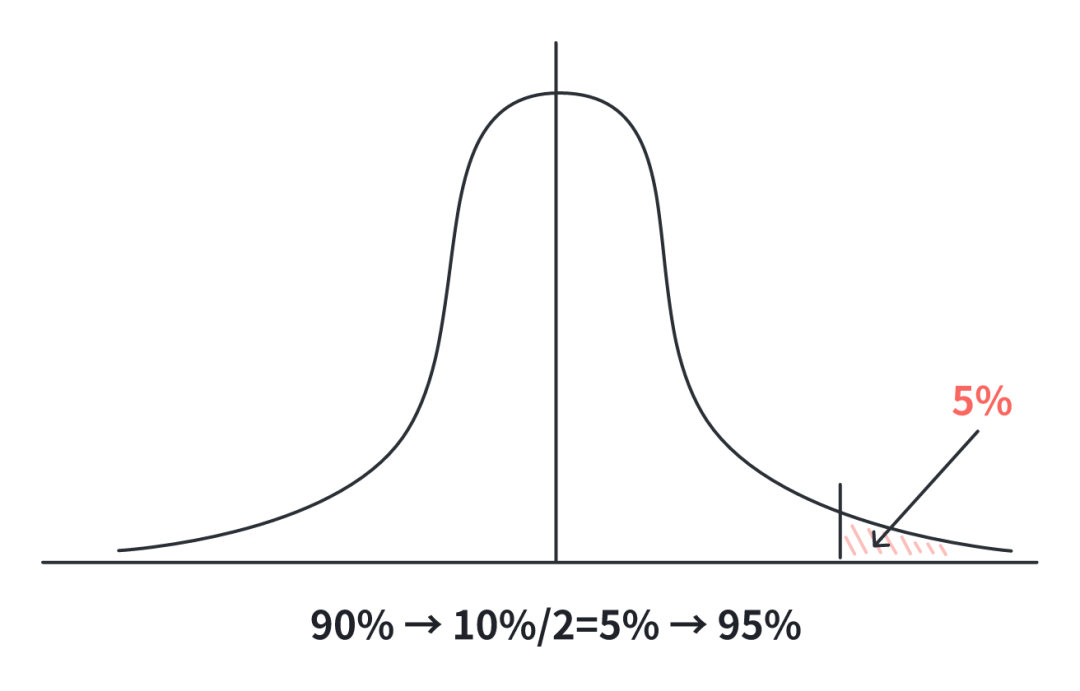
Think of a 90% confidence level like this: it means we want the middle 90% of our data, which leaves 5% on each tail (since 100% - 90% = 10%, split evenly between both ends at 5% each).

For a standard normal distribution, you'll need to find a Z-score with a 95% cumulative probability (50% + 45%). Here's why: 50% covers the area from the leftmost point to the middle, and 45% covers the area from the middle to your Z-score point.
For different confidence levels, here's how to find the right numbers:
-
For 95% confidence → 5%/2 = 2.5% → Look for 97.5%
-
For 99% confidence → 1%/2 = 0.5% → Look for 99.5%
2.2 Read the Z-score Table
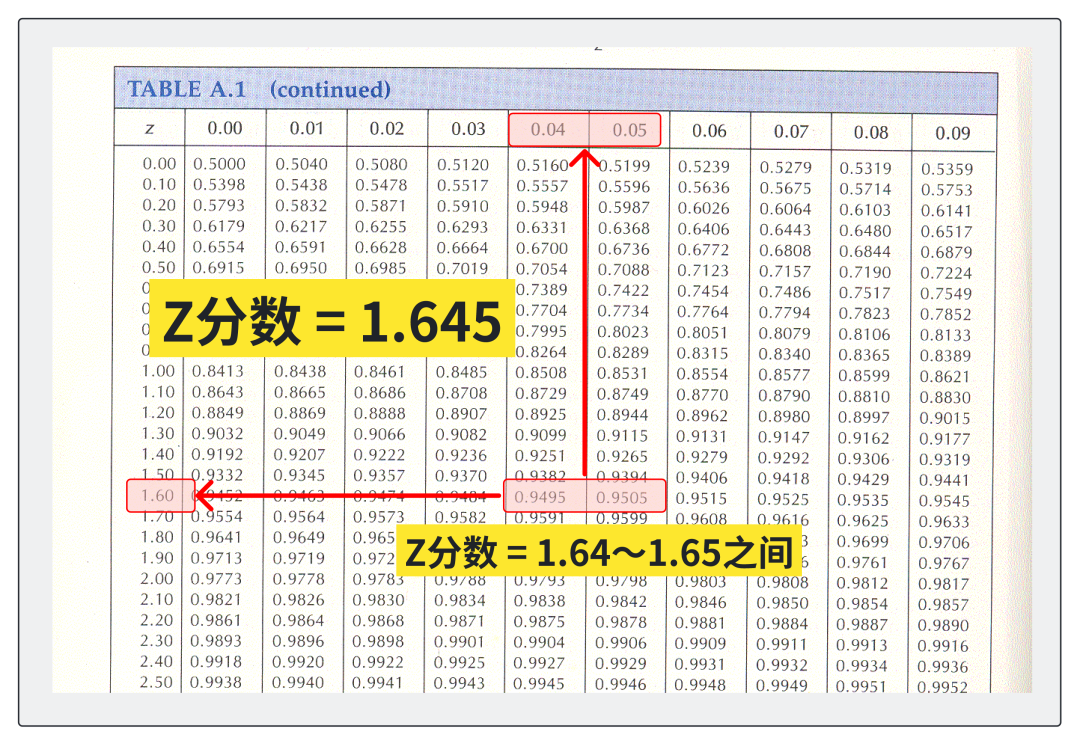
The Z-score table displays cumulative probabilities in two ways - from the far left of the distribution, or from the middle (mean) to any Z point. When using this table, you'll need to find Z-scores with cumulative probabilities of about 95%.
2.3 Finding the Right Probability
Check the Z-score table and look for the value nearest to 95%. Most tables show the cumulative probability starting from the leftmost point (negative infinity) up to each Z-value. For these tables, you want to find 0.9500.
Some tables show probability from the mean (where Z = 0) to each Z point instead. With these tables, look for values around 45% (0.4500).
In our example here, we're using the first type of table - so we simply need to find the closest value to 0.9500.

2.4. Finding Your Z-score
Look at where the rows and columns intersect in the Z-score table. Find the value closest to 0.9500 (which represents 95% cumulative probability from the left tail).
Looking at our table, we can see that 95% falls between Z-scores of 1.64 and 1.65. Taking the midpoint gives us our Z-score of 1.645.
This means that for a 90% confidence level, we use a Z-score of 1.645.
You can use the same process to find Z-scores for other confidence levels like 95% and 99% by looking up their corresponding values in the table.
3. Calculating Your Sample Size
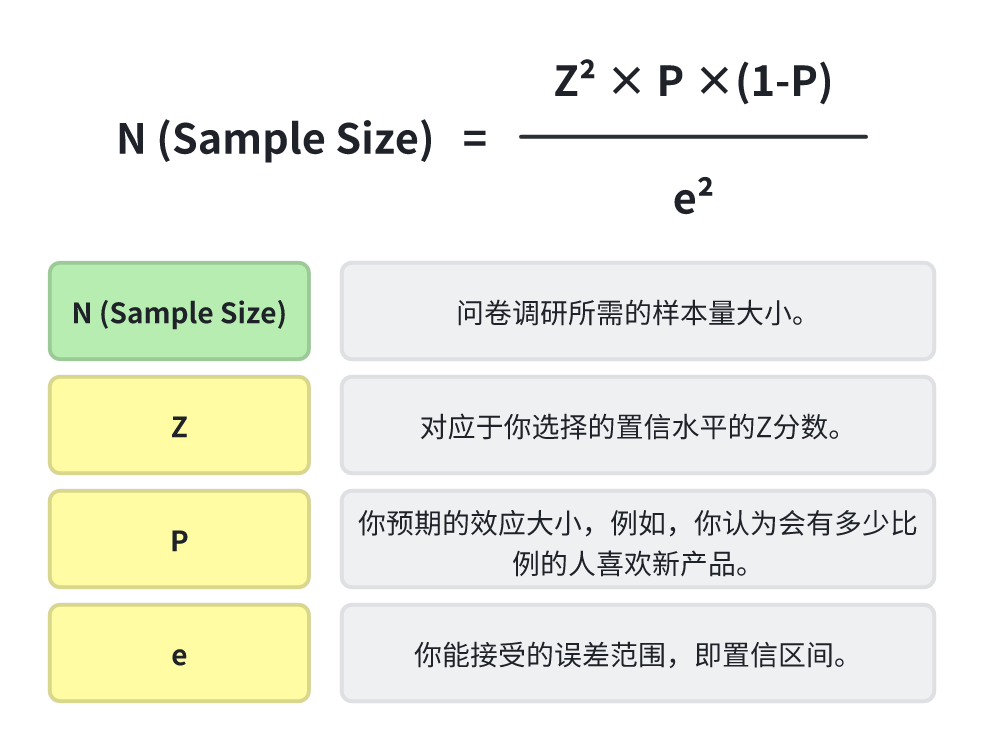
To determine your sample size, you'll need three key pieces of information:
3.1 Confidence Level (Z-score): What level of confidence do you need in your results? This determines which Z-score to use.
3.2 Expected Effect Size (P): What's the smallest difference you want to detect? If you're unsure, use P = 0.5 as it gives you the largest (most conservative) sample size.
3.3 Margin of Error (e): How much variation can you accept in your results? If unsure, use 0.05 (5%) as a standard margin of error.
With these three numbers, you can plug them into the sample size formula to calculate how many responses you need. This ensures your survey results will be both statistically significant and truly representative of your population.
Here's a simple formula you can use to estimate your sample size:

This formula works great for estimating sample size when you don't know your total population size. It's especially handy for large populations, since population size doesn't have much impact on the sample size needed when dealing with really big numbers.
Let's work through an example calculation using these parameters:
-
Confidence level: 95% (giving us Z = 1.96)
-
Effect size (proportion): P = 0.5
-
Margin of error: e = 0.05 (5%)
Plugging these numbers into our formula:
N = (1.96² × 0.5 × (1 – 0.5)) / 0.05² = 384.16
Based on this calculation with a 95% confidence level, 0.5 effect size, and 5% margin of error, we need a sample size of about 384.16.
Since we can't survey a fraction of a person, we round up to 385 samples. This means your survey or experiment needs at least 385 participants to get statistically meaningful results you can trust.
Related articles


